Poverty Rate Dropped Again In 2019; A Sign Of Progress
-

-

Published Friday, September 25, 2020, 8:00 PM EST

Progress is like watching paint dry. The world changes right in front of us all but we easily miss the progress occurring right before our eyes!
The annual report on poverty in the United States from the U.S. Census Bureau was released last week and shows that the poverty rate dropped again in 2019, to a new all-time low.
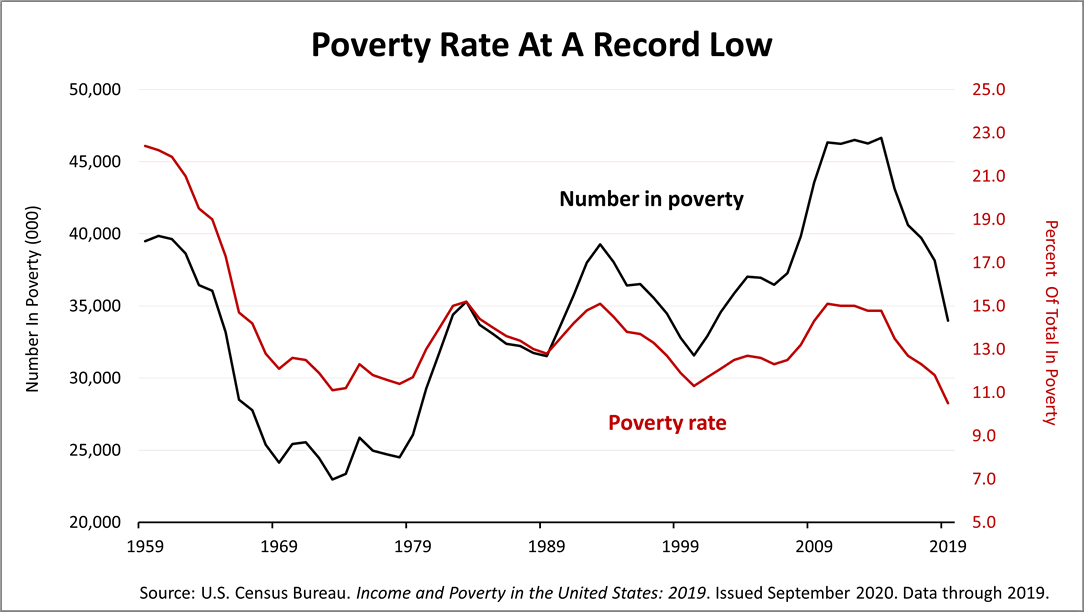
Income and Poverty in the United States: 2019, issued September 2020, is based on data through 2019, before the Covid pandemic. The secular trend – the long-term perspective – shows progress is reason to be optimistic.
While critics say the decline in the poverty rate to 10.5% are already outdated because it does reflect the pandemic's effects, the path to less poverty in America has been a long-term struggle through the post-War era.
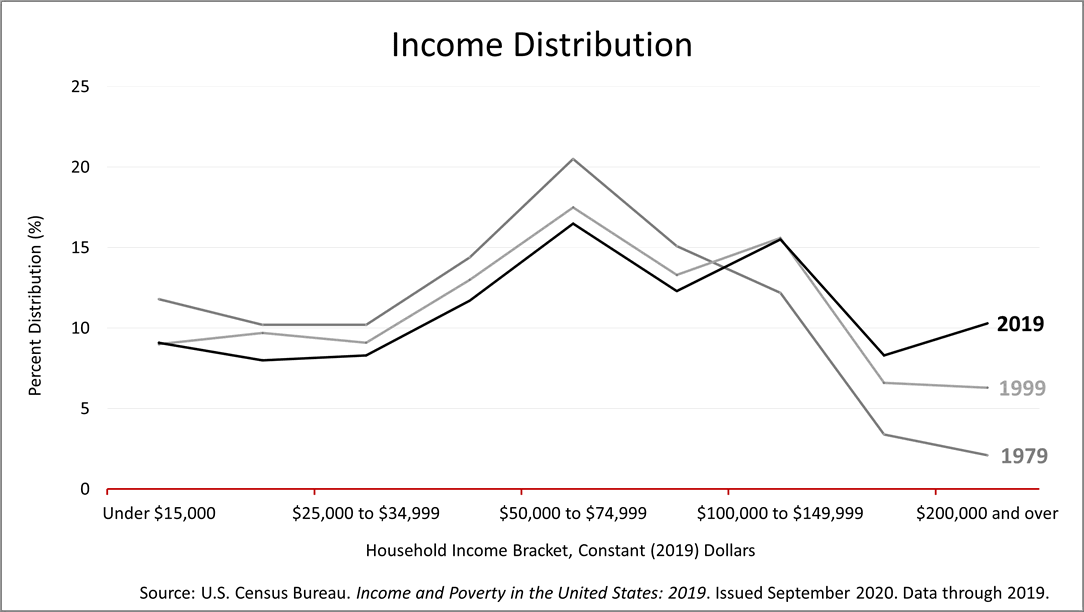
The distribution of income across American households over the last 40 years is a picture of progress.
The percentage of the total number of households that fall into each of the income brackets as of 1979, 1999, and 2019 show income inequality is less of a problem. Though this is not intended as a measure of the increased influence of billionaires, the income distribution curve has flattened and shifted to the right over the past four decades. There are fewer households earning $50,000 to $75,000 annually because many more are earning $100,000 to $150,000 and up!
In inflation adjusted dollars, the distribution of income by income bracket has broadened, reflecting an improvement in the character of wealth distribution in the U.S.
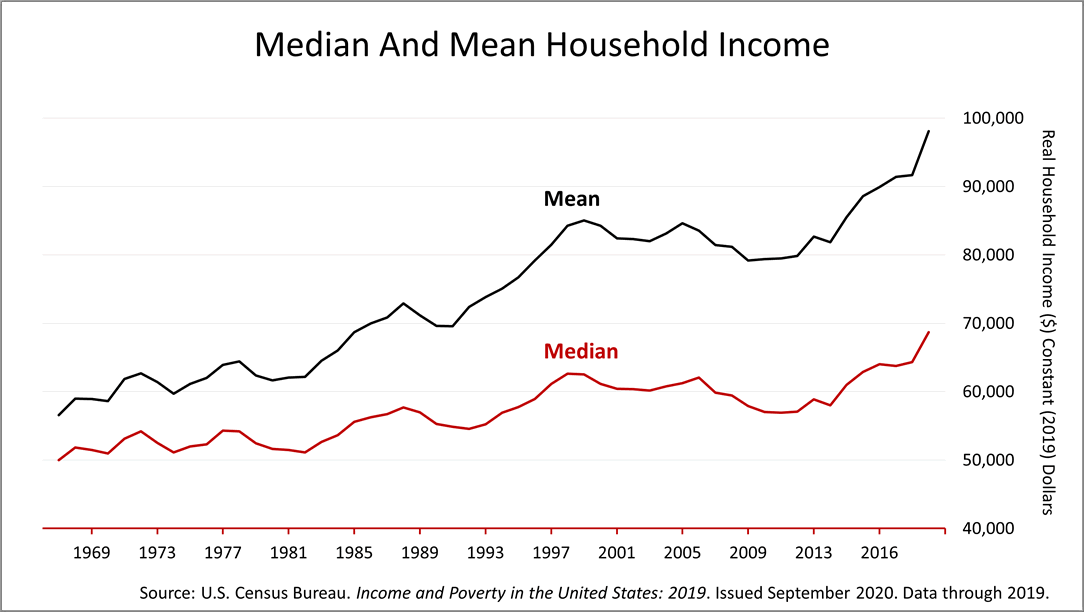
Median and mean household income both hit records, according to the new report. Over the 50 years illustrated here, mean income has grown faster than median income, a reflection of the improved character of household income distribution.
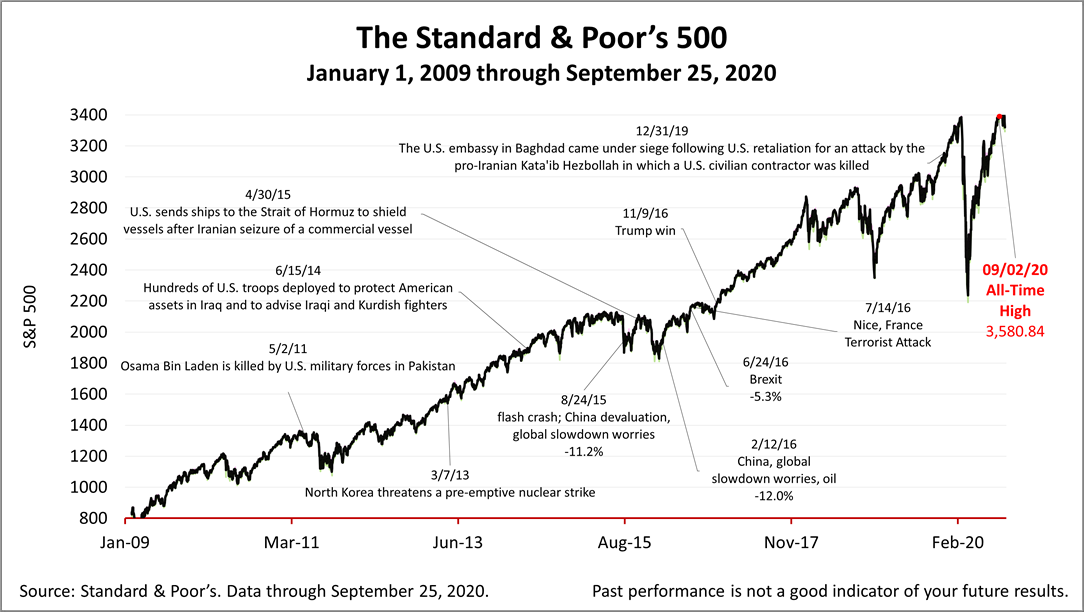
The Standard & Poor's 500 stock index closed Friday at 3,298.46, up +1.6% from Thursday, a drop of -0.63% from a week ago, and +38.33% higher than its March 23rd bear market low.
This marked the fourth straight week of declines in the S&P 500. The S&P 500 reached unprecedented highs in early September due to a surge in large-cap tech stocks, but those same tech stocks have seen declines in the past few weeks. So far, the S&P 500 has fallen 5.8% in September. Stock prices have swung wildly since the coronavirus crisis started in March and volatility is to be expected in the months ahead.
The Standard & Poor's 500 (S&P 500) is an unmanaged group of securities considered to be representative of the stock market in general. It is a market-value weighted index with each stock's weight proportionate to its market value. Index returns do not include fees or expenses. Investing involves risk, including the loss of principal, and past performance is no guarantee of future results. The investment return and principal value of an investment will fluctuate so that an investor's shares, when redeemed, may be worth more or less than their original cost. Current performance may be lower or higher than the performance quoted.
Nothing contained herein is to be considered a solicitation, research material, an investment recommendation, or advice of any kind, and it is subject to change without notice. It does not take into account your investment objectives, financial situation, or particular needs. Product suitability must be independently determined for each individual investor.
This material represents an assessment of the market and economic environment at a specific point in time and is not intended to be a forecast of future events or a guarantee of future results. Forward-looking statements are subject to certain risks and uncertainties. Actual results, performance, or achievements may differ materially from those expressed or implied. Information is based on data gathered from what we believe are reliable sources. It is not guaranteed as to accuracy, does not purport to be complete, and is not intended to be used as a primary basis for investment decisions.
This article was written by a veteran financial journalist based on data compiled and analyzed by independent economist, Fritz Meyer. While these are sources we believe to be reliable, the information is not intended to be used as financial advice without consulting a professional about your personal situation. Indices are unmanaged and not available for direct investment. Investments with higher return potential carry greater risk for loss. Past performance is not an indicator of your future results.
2024
-
 Stocks Closed At A Record High
-
 Federal Reserve Projects Strong Growth
-
 The Best People Were Wrong
-
 This Week’s Investment News In Six Charts
-
 U.S. Investor Picture Of The Week
-
 The Conference Board Backs Off Its Recession Forecast
-
 Softening Economic Data, Inflation Fears Dampen Stock Rally
-
 S&P 500 Closes Above 5000 For The First Time Ever
-
 Why America Is The World’s Economic Leader
-
 Investment News For The Week Ended Friday, January 26
-
 Why Stocks Broke The All-Time Record High
-
 A Strategic Update, With Stocks Near All-Time High And Crises Unfolding


")