Analyzing The Risk Of Stocks After The 6.9% Drop
-

-

Published Friday, October 12, 2018 at: 7:00 AM EDT
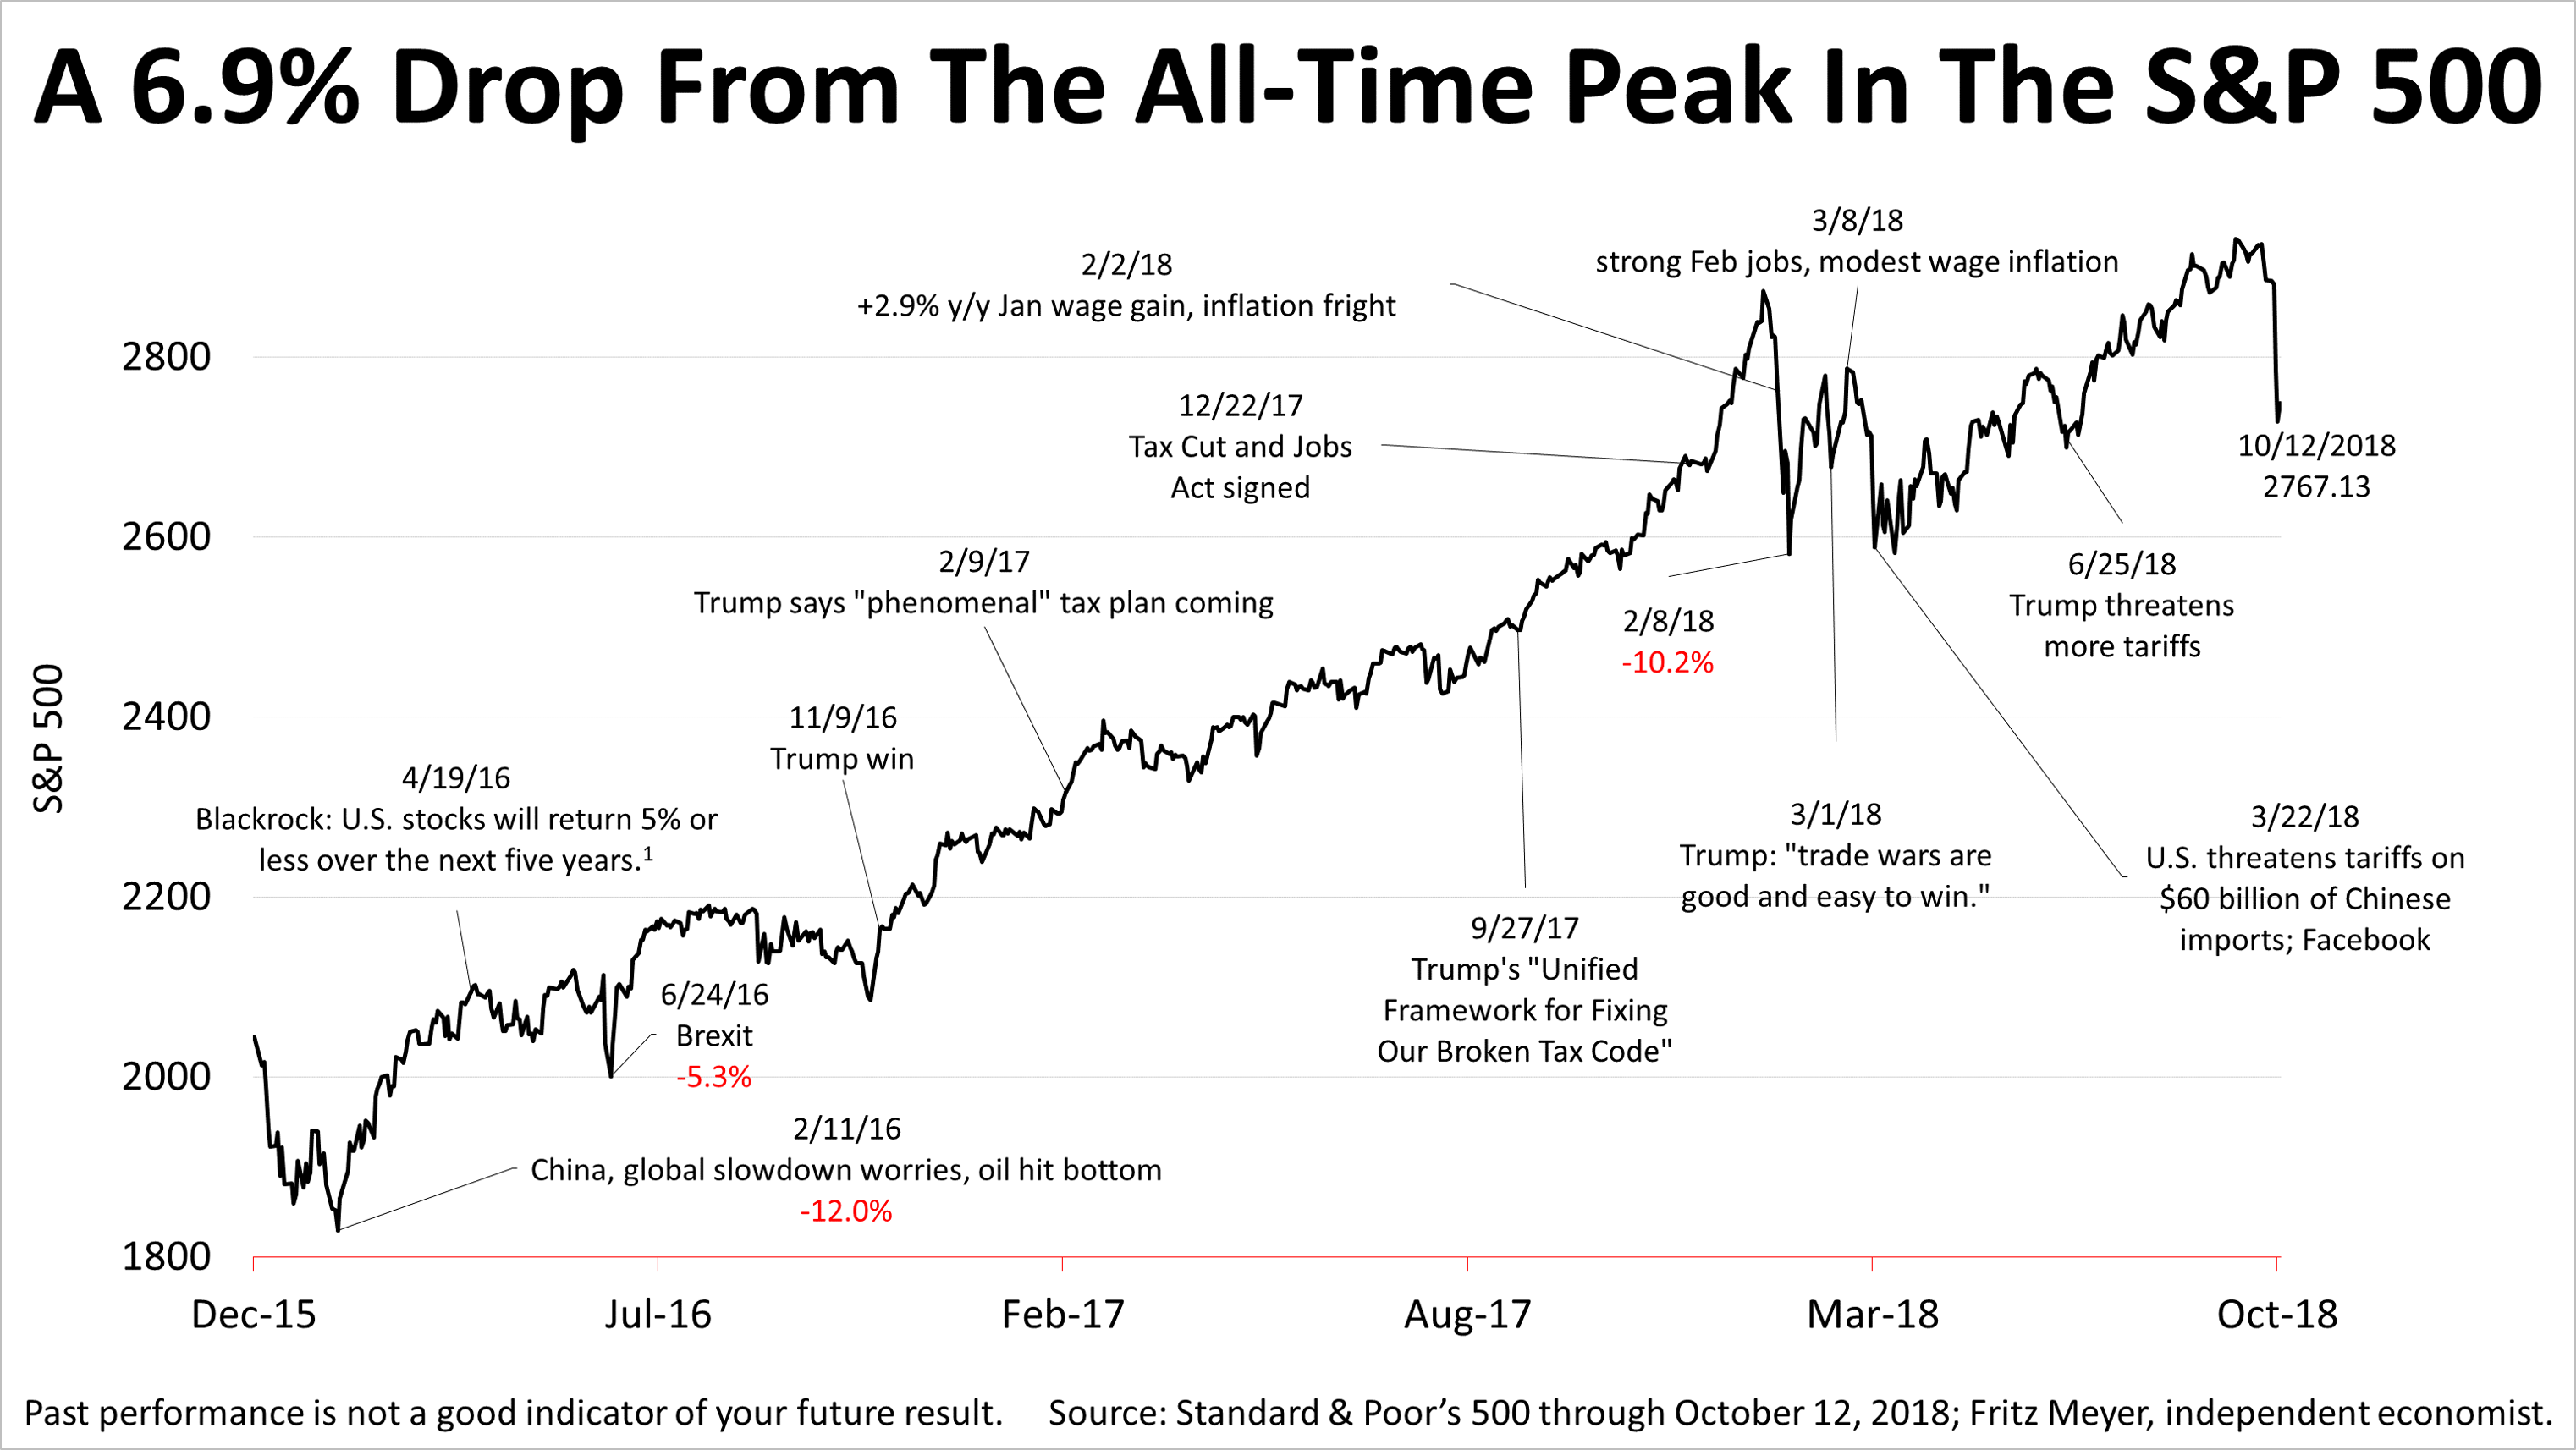
The stock market snapped a six-day losing streak on Friday, with the Standard & Poor's 500 closing at 2767.13.
From its peak all-time close on September 20, to its closing low on Thursday, the S&P 500 plunged 6.9% in the six-day drop.
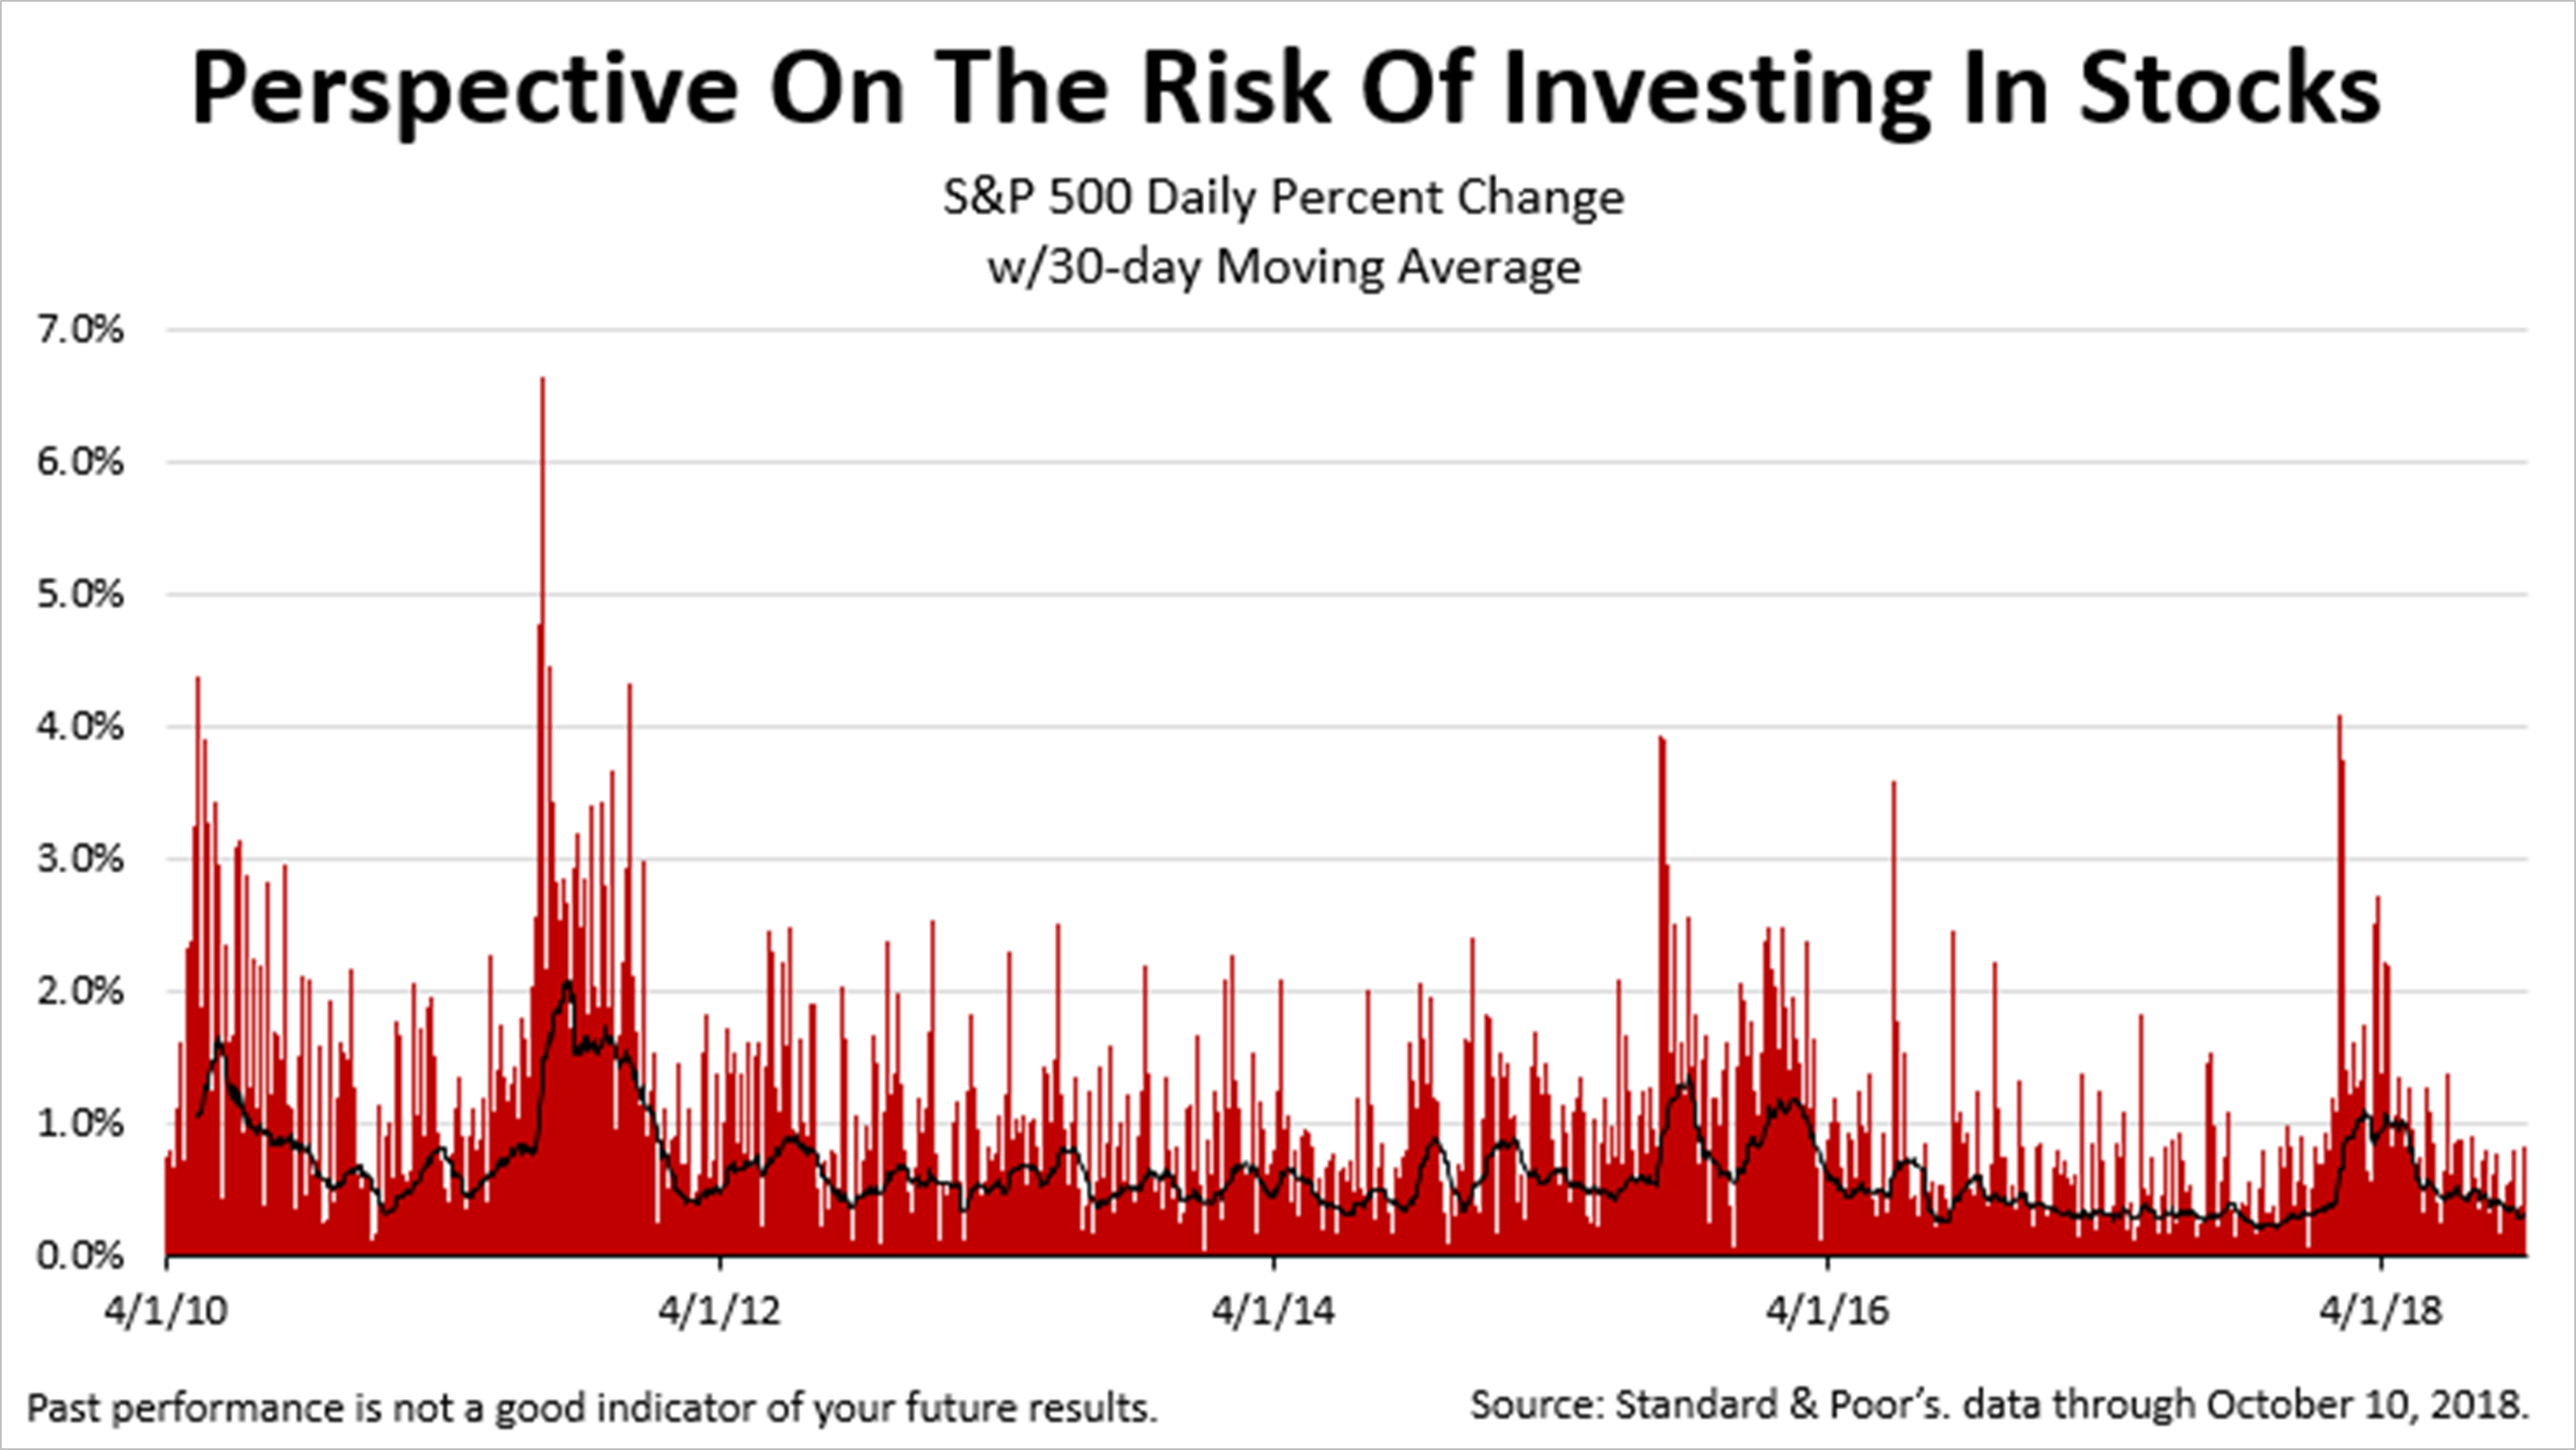
The volatility in recent days is not so frightening in the context of the last eight-plus years, this chart indicates. The red lines represent the daily percentage change in the average price of a share in the S&P 500 since April 2010, and the black line is the 30-day moving average of the S&P 500 share price.
Price volatility is a key way of measuring the risk of owning stocks, especially since the most volatile days are losing days. While one-day spikes are frightening losses, the 30-day average price moves along much more smoothly. Trouble is, when you are in the middle of a red-line period, it's hard to focus on the black line. It's often hard to believe that prices historically smooth over, over longer periods and there is a good chance of that happening again.
In fact, this is why investors get paid a premium for the risk of owning stocks versus other less volatile alternatives. Over the decades, stocks historically returned about 10% annually. Nothing ever is guaranteed in investing but that's about 6% more annually than the return on a 30-day U.S. Treasury-backed fixed income investment. That equity risk premium was awarded to investors for putting up with the volatility of stocks.
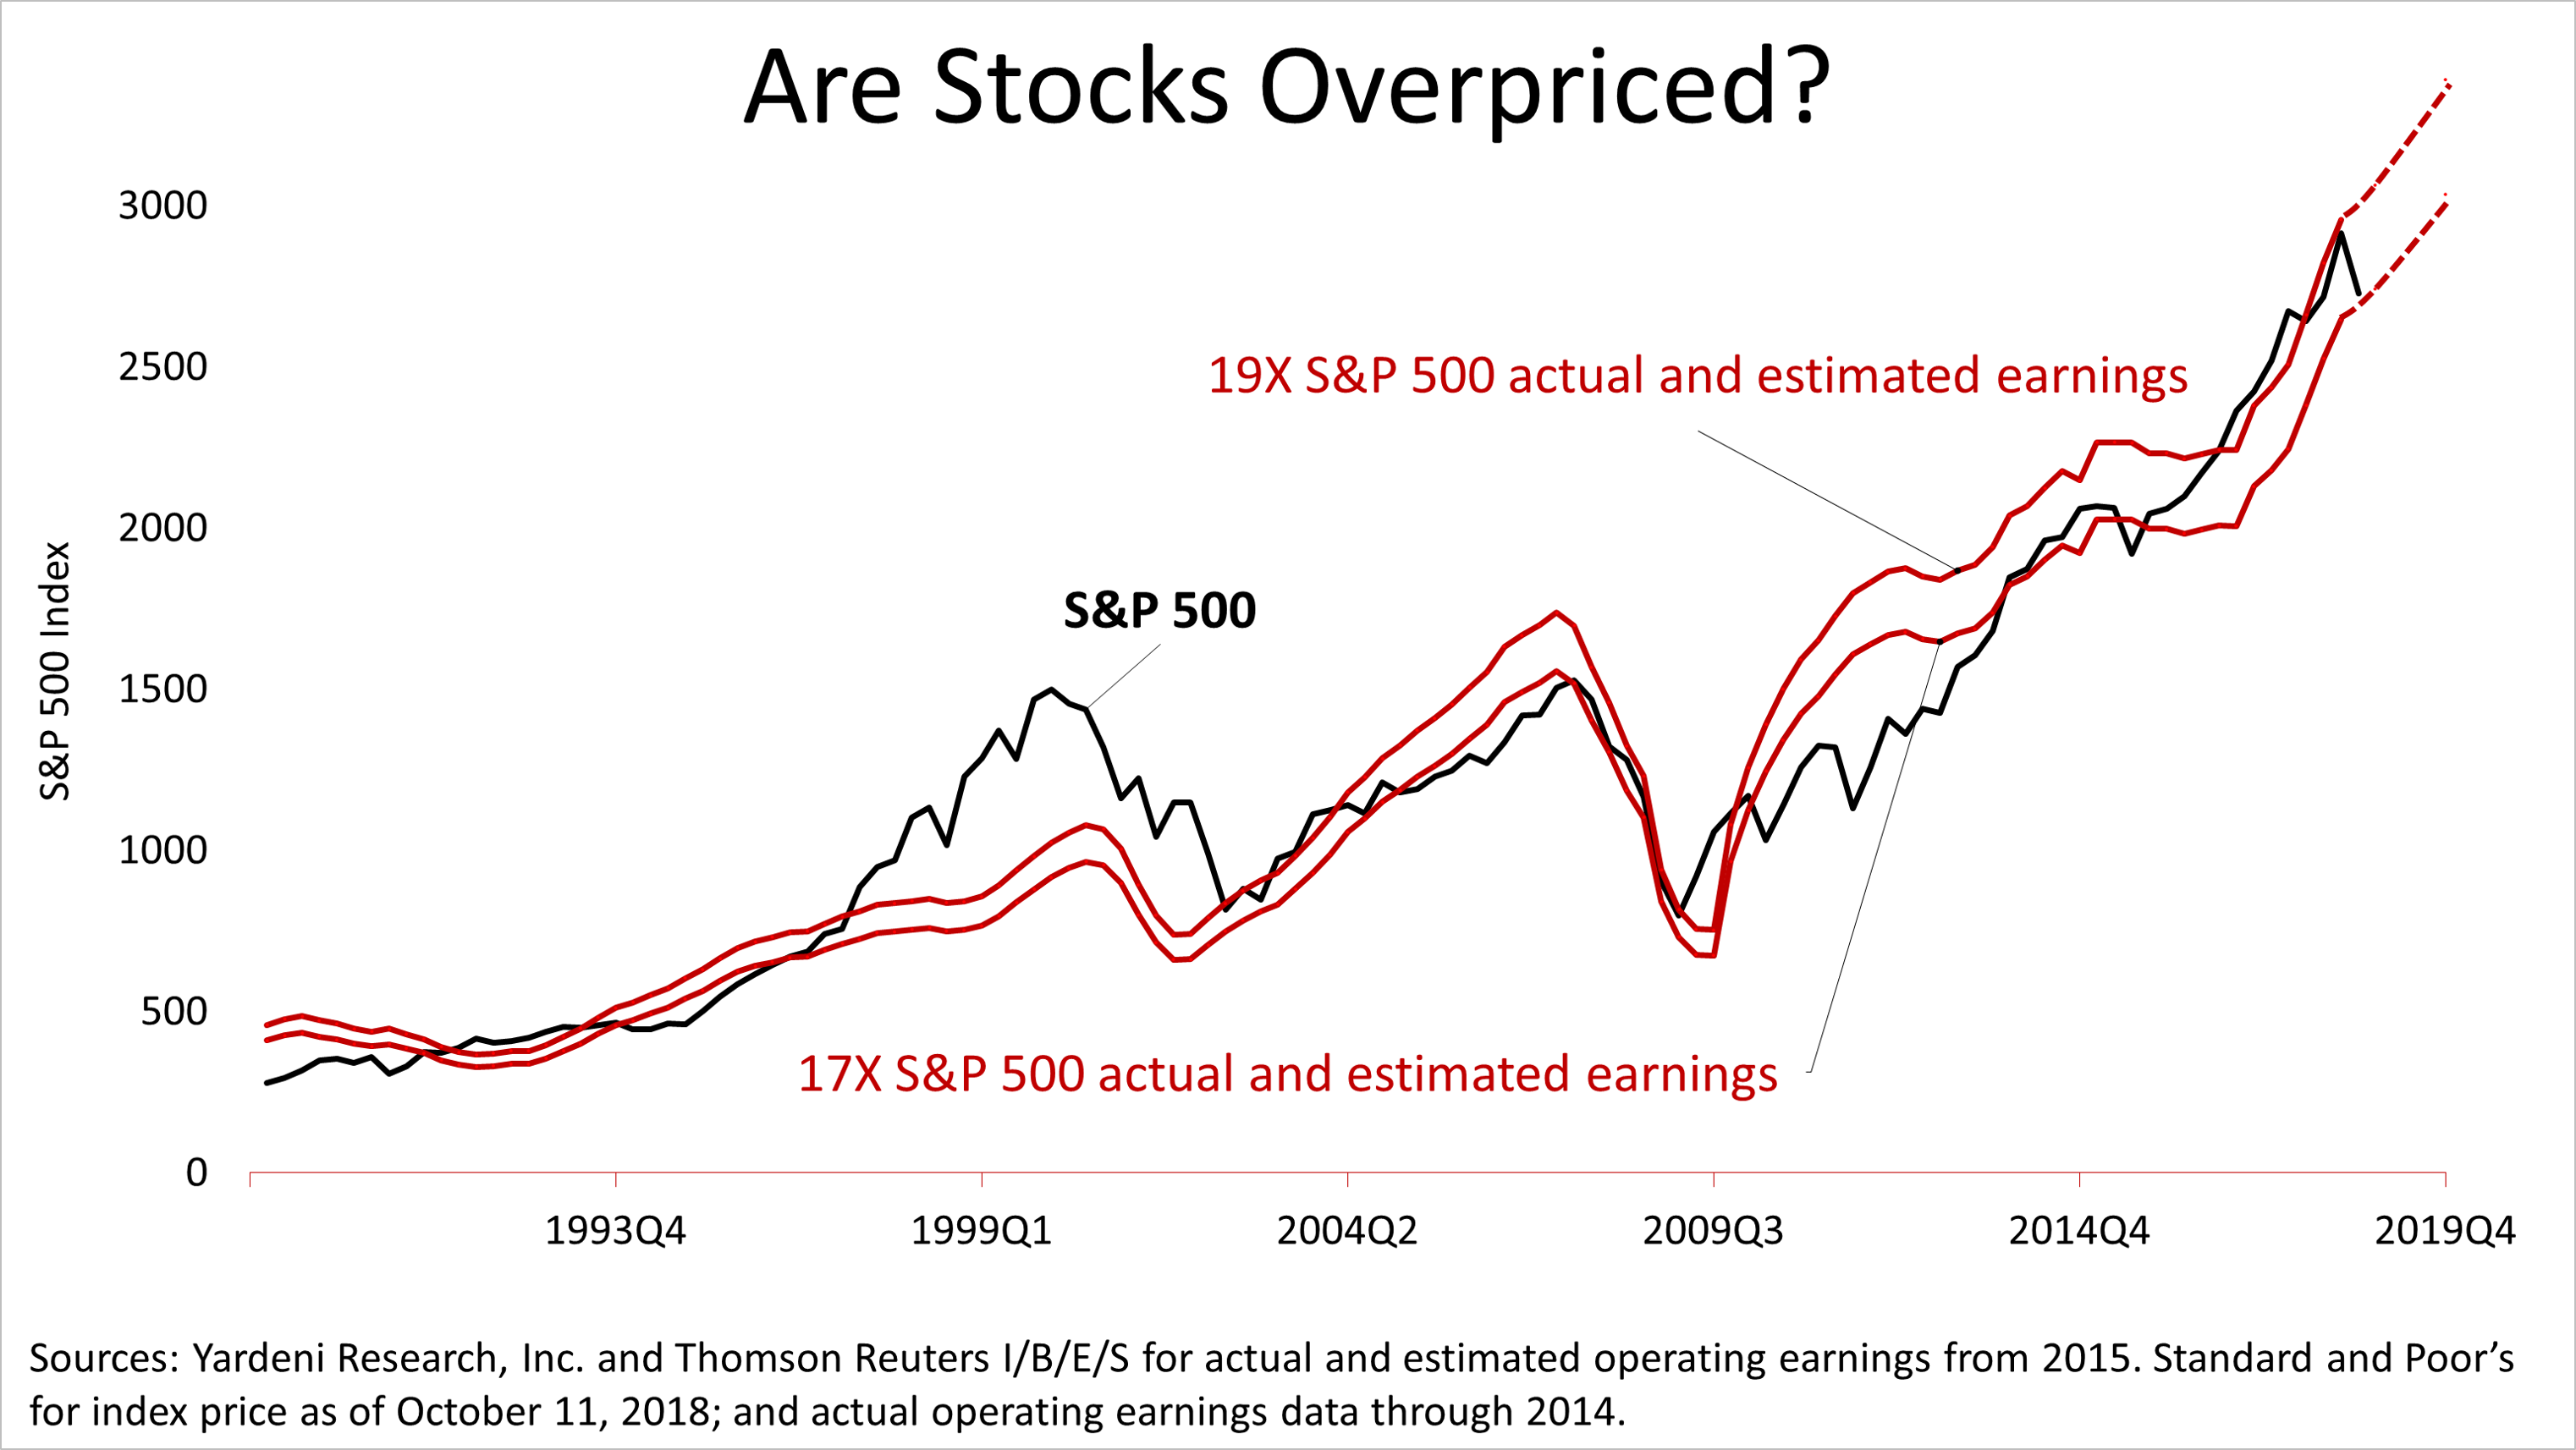
If the recent volatility unnerved you, keep the following lesson in mind: Corporate profits have always driven the value of share prices in the S&P 500 stock prices in the long run, and this chart shows current as well as expected profits, which indicate stock prices are not unreasonable compared to their history.
The black line shows the price of the S&P 500 index since 1990, while solid red lines represent the upper and lower bands of valuations placed on stocks. If a share in the S&P 500 was priced at 17 times 12-month trailing profits, the lower red price line would have resulted, while a price-to-earnings multiple of 19 would have created the upper red line. The dotted lines represent forecasts by Wall Street analysts for earnings at the same price-to-earnings multiples. This indicates share prices are at the lower end of their historical valuation range following the recent drop of 6.9%.
1Investment News, April 19, 2016, by John Waggoner.
2017, 2018 (estimated) and 2019 (estimated) bottom-up S&P 500 operating earnings per share as of October 1, 2018: for 2017, $131.98; for 2018(e), $161.19; for 2019(e), $178.43. Sources: Yardeni Research, Inc. and Thomson Reuters I/B/E/S for actual and estimated operating earnings from 2015. Standard and Poor's for index price data as of October 11, 2018; and actual operating earnings data through 2014.
This article was written by a veteran financial journalist based on data compiled and analyzed by independent economist, Fritz Meyer. While these are sources we believe to be reliable, the information is not intended to be used as financial advice without consulting a professional about your personal situation. Indices are unmanaged and not available for direct investment. Investments with higher return potential carry greater risk for loss. Past performance is not an indicator of your future results.
This article was written by a veteran financial journalist based on data compiled and analyzed by independent economist, Fritz Meyer. While these are sources we believe to be reliable, the information is not intended to be used as financial advice without consulting a professional about your personal situation. Indices are unmanaged and not available for direct investment. Investments with higher return potential carry greater risk for loss. Past performance is not an indicator of your future results.
2024
-
 Stocks Closed At A Record High
-
 Federal Reserve Projects Strong Growth
-
 The Best People Were Wrong
-
 This Week’s Investment News In Six Charts
-
 U.S. Investor Picture Of The Week
-
 The Conference Board Backs Off Its Recession Forecast
-
 Softening Economic Data, Inflation Fears Dampen Stock Rally
-
 S&P 500 Closes Above 5000 For The First Time Ever
-
 Why America Is The World’s Economic Leader
-
 Investment News For The Week Ended Friday, January 26
-
 Why Stocks Broke The All-Time Record High
-
 A Strategic Update, With Stocks Near All-Time High And Crises Unfolding


")